
App Usage Statistics 2024: Downloads, Revenue, Popularity
Posted by Darko Radić

Apps have taken over the world in record time, and we all use them. Plus, new and better apps appear daily, making our lives easier than ever.
But do you know how many apps there are or how many we typically use? We collected the most recent stats and facts about the global app industry, so let’s cut to the chase.
Top App Usage Statistics and Facts | Editor’s Choice
- By 2023, mobile apps could generate over $935 billion in revenue.
- The yearly mobile app consumer spending could reach $171 billion by 2024.
- TikTok recorded 850 million downloads in 2020.
- 39% of smartphone owners delete apps because they don’t use them anymore.
- Roblox was the top-earning iPhone gaming app in the US in March 2021.
- In the Google Play Store, gaming apps are the most popular, with a 13.72% share.
- One in five adults in the United States uses a health app.
- The average millennial has more than 67 apps installed on a smartphone.
- The Apple App Store is among the most popular app vendors, offering around 1.8 million apps.
- Samsung holds 37.1% of the Android vendor market share.
App Market Statistics
Mobile app development is a booming market, with millions of publishers trying to create the next big thing. For instance, voice search has become the norm, but many other elements play a role in the app industry.
1. In 2020, the overall number of mobile apps reached 8.93 million.
The global app market is growing fast, with new apps coming out daily. In 2019, the total number was 7.6 million, increasing by 18% in 2020.
As expected, the COVID-19 outbreak triggered new apps, but the market had already started expanding.
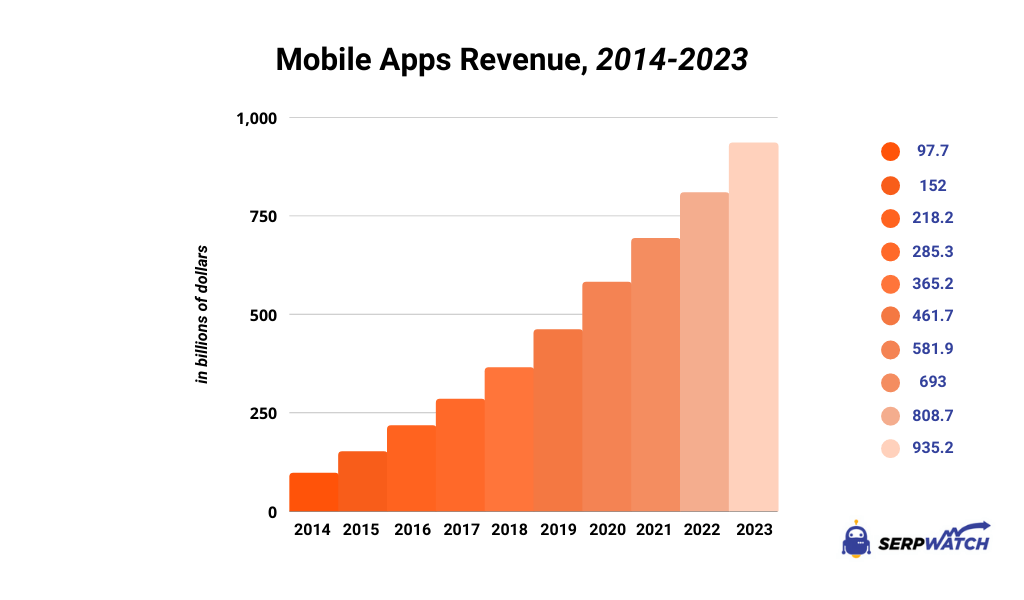
2. According to app sales statistics, mobile apps could generate more than $935 billion in revenue by 2023.
The adoption of smartphones and tablets boosted the earnings coming from in-app advertising and paid downloads. In 2018, the global mobile app revenue was at $365 billion, and a five-year projection estimated that the earnings would triple.
Both gaming and non-gaming app publishers expect further growth in revenue in 2021 and beyond.
3. The average usage of mobile network data traffic exceeds 10GB per month.
According to mobile app usage statistics, the network data “consumed” by mobile apps grew 46% between the first quarters of 2020 and 2021. Consequently, the number of Google searches per day also grew.
By the end of 2026, the average use of network data traffic per smartphone could reach 35GB. Currently, video traffic accounts for 66% of mobile data traffic share.
4. In the third quarter of 2020, the global consumer spending via mobile apps reached $29.3 billion.
As expected, the lockdown measures caused by the outbreak of COVID-19 increased mobile consumer spending in apps.
Precisely, app usage statistics show that the combined installs across Google Play and App Store in Q3 2020 reached 36.5 million.
5. Despite COVID-19, the yearly app spending could grow to $171 billion by 2024.
With a CAGR of 9.8%, the number of first-time installs could also grow, reaching 183.7 million globally.
As a result, app spending will also increase. For instance, spending on non-game apps could exceed the spending on gaming apps for the first time, powered by subscription revenue.
App Download Statistics
Mobile devices and apps are inseparable, so it’s no surprise that the number of mobile app downloads worldwide reached a whopping 218 billion in 2020. Let’s take a look at the stats and facts regarding some of the most popular apps today.
6. In 2020, TikTok recorded 850 million downloads.
Despite the controversies, TikTok dominated the number of downloads in 2020 compared to all other apps. As a result, both businesses and individuals jumped on the bandwagon and started creating short-form video content.
Likewise, apps like Zoom and Google Meet experienced a surge in popularity, primarily because of the COVID-19’s impact.
7. In March 2020, TikTok’s average app downloads per month increased by 98.4% compared to March 2019.
Also known in China as Douyin, TikTok is a short video app whose popularity skyrocketed in early 2020. In March only, TikTok had 115.2 million installs worldwide, making it the most popular non-game app.
Amazingly, TikTok’s journey to the top lasted less than four years, despite censorship battles and country bans.
8. In 2020, the most downloaded free app in the United States was Zoom Cloud Meetings.
When it comes to the most popular apps in the US, Zoom topped the list of downloads during the turbulent 2020. Namely, the outbreak of COVID-19 triggered the need for video conferencing and remote contact.
TikTok came as a close second, while Disney+ entered the US mobile app market and ranked third in the total number of downloads. Among Us and Call of Duty: Mobile ranked the highest in the top free game category.
9. In its first year, Disney+ reached 100 million downloads globally.
Speaking of Disney+, we should mention that app store statistics show impressive results this app achieved in its first year.
Around two-thirds (62%) of downloads came from the US, but Disney+ attracted plenty of global attention as well. As a result, the app raked in around $285 million through mobile in-app purchases.
10. 39% of users uninstall an app because they no longer use it.
People don’t only download apps—they also remove them from their mobile devices. For instance, 28% of users uninstall apps because the software displays too many ads and notifications. Likewise, 20% of people remove apps from devices because of limited storage space.
App Revenue Statistics
People worldwide use apps, and various publishers try to meet the demand by designing attractive and efficient software. Also, they try to monetize their products, so here’s what the numbers say regarding app revenue.
11. The global app revenue grew by 32% year-over-year in the third quarter of 2020 and reached $29 billion.
Consumer spending on App Store and Google Play apps increased by 32% in the period between Q3 2019 and Q3 2020. Also, the number of installs climbed to 36.5 billion. In comparison, the growth rate between Q3 2018 and Q3 2019 was 24%.
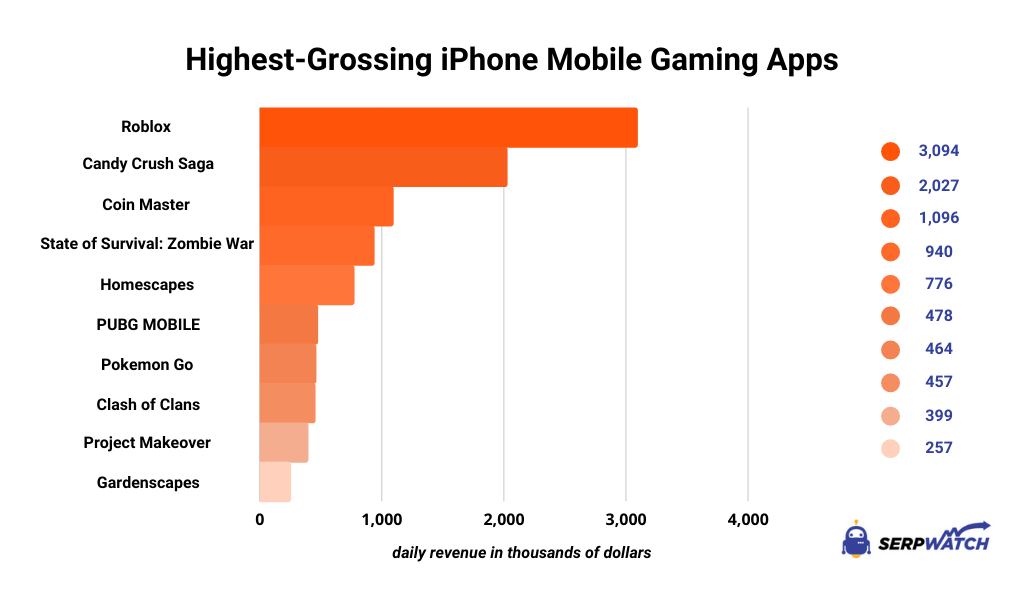
12. According to mobile app sales statistics, Roblox was the top-earning iPhone gaming app in the US in March 2021.
Ranked by daily revenue, Roblox and Candy Crush Saga topped the list of top-grossing mobile gaming apps in March 2021.
Roblox generated approximately more than $3.09 million daily, while Candy Crush Saga grossed around $2.03 million per day.
13. In Q2 2020, Google Play Store raked in $7.7 billion in gross revenue from mobile games.
Mobile gaming has grown into a massive industry. According to Google Play Store statistics, the platform increased its revenue to $7.7 billion from $6.9 billion generated in Q1 2020.
Of course, the primary monetization strategy in the mobile gaming market is in-app purchases, but advertising and ecommerce play a role as well.
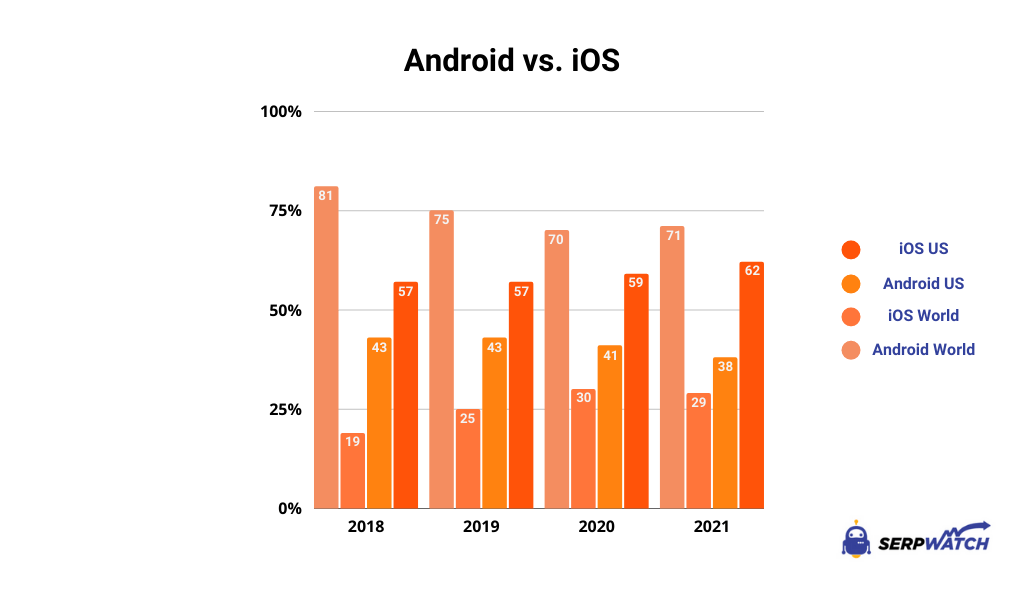
14. Despite having 15% of the global market share, Apple iOS dominates revenue generation.
Revenue-wise, Android and iOS combined generated $111 billion in 2020, translating to a 24% year-on-year increase. But when it comes to Android vs. iPhone percentage, iOS got a bigger slice of cake with 65% of the total app revenue.
For the non-gaming market, the results work in iOS’s favor because it generated 76% of the $32.1 billion revenue in 2020.
15. Amid COVID-19, mobile gaming revenue reached $19.3 billion in Q2 2020 and recorded a 27% year-over-year growth.
Compared to Q1 2020, the revenue grew by 10.3%, coinciding with the global spread of COVID-19.
Aside from the increase in international usage of apps, statistics also show that new installs peaked in April 2020 and reached 5.5 billion.
16. Globally, PUBG Mobile was the top-grossing game during Q2 2020.
Published by Tencent, PUBG Mobile still has a massive following worldwide. So, it’s not surprising to see that this mobile gaming app generated around $621 million during the second quarter of 2020.
MMO Roblox and Fortnite also earned massive amounts across app stores. In other words, gaming apps benefited from lockdown measures when people were looking for entertainment.
Popular App Categories
Since users have different interests and hobbies, modern apps come in various flavors. Moreover, they cover almost every area of our lives. Yet, not all apps are the same, and some are more popular than others. Here’s what the stats say.
17. In the first quarter of 2021, gaming apps were the most popular in Google Play Store, with a 13.72% market share.
Unsurprisingly, gaming apps are at the top of the list of the most popular categories in Google Play. Still, smartphone app usage statistics also show that education apps have a considerable market size with a 9.31% share.
Most apps in the Google Play library are free, and users can download 96% of them without having to pay upfront.
18. Amazon Appstore offers around 460,000 Android apps, with gaming and education the most popular categories.
Like Google Play Store and Apple App Store, the Amazon App store predominantly offers gaming apps. However, the expansion of the Amazon empire affected its app library as well, and it now provides much more than ecommerce and cloud computing.
Namely, app usage statistics for 2021 reveal a 0.32% growth in the number of apps in the Amazon App Store in Q1 2021 compared to Q4 2020.
19. Business apps were the second-most popular app category in the Apple App Store in March 2021.
As expected, the most popular iOS app category is gaming, accounting for 21.53% of all apps in the library. This type also generates the highest revenue, mainly through in-game item purchases. Yet, the second-ranked category is business, with a 10.11% market share.
20. According to health app usage statistics, one in five adults in the US uses a health app.
Health and fitness industries are reaping the benefits of mobile technologies, and many wearable devices track our health and help with prevention and treatment.
Most people opt to use fitness trackers and health apps, but 9% only rely on mobile health apps while 8% only use a fitness tracker.
21. In April 2020, the leading mHealth app, Calm, had 3.9 million downloads.
Judging by the health and fitness app usage statistics, around four million people used the most popular meditation app in April 2020. Likewise, stats also show that Headspace, a similar mobile app, had 1.5 million downloads in the same period. Moreover, the overall usage of health apps grew by 40% during the pandemic.
22. In 2021, the global mHealth market could reach $100 billion.
Since 2016, the mobile health app market has been growing at a steady rate. Still, the outbreak of COVID-19 boosted the adoption of health and fitness apps. As a result, the market could grow fivefold from $21 billion in 2016.
App Usage Demographics
Different demographic groups use specific apps and services in line with their interests and activities. Also, some groups use more apps than others, so let’s see what the numbers show.
23. 21% of millennials admit opening any app more than 50 times a day.
Given that 85% of Americans own a smartphone, it’s not surprising to see a rise in app usage. For instance, millennials are often “addicted” to mobile apps, unlike baby boomers, where only 2% open any app 50 times a day.
Of course, the most popular apps for iPhones and Android devices are social media apps. Precisely, 40% of smartphone owners list these apps as the ones they use the most.
24. On average, millennials have more than 67 apps on their smartphones.
Even though millennials have plenty of apps installed on their phones, they commonly use around 25 apps. Favorite ones come from the social, communication, and gaming categories.
On the other hand, the apps with usage below 4% come from ecommerce, travel, finance, and maps categories.
25. According to app usage demographics, US adults spend more than four hours on the mobile internet.
Statistics show that out of four hours users spend on mobile internet, 88% is spent on mobile apps. The percentage is even higher (90%) when looking at smartphones only. Conversely, 83% of the time we spend with our tablets “requires” the use of apps.
Thus, it’s clear that smartphones and tablets have become almost synonymous with the use of mobile apps.
iOS App Usage Statistics
As one of the two leading operating systems, iOS attracts plenty of attention. Thus, developers worldwide compete to make the best applications for iOS and many businesses worldwide hire iOS developers to make the best applications for Apple devices. Of course, many fail, but plenty of apps in the App Store are downloaded by millions of users.
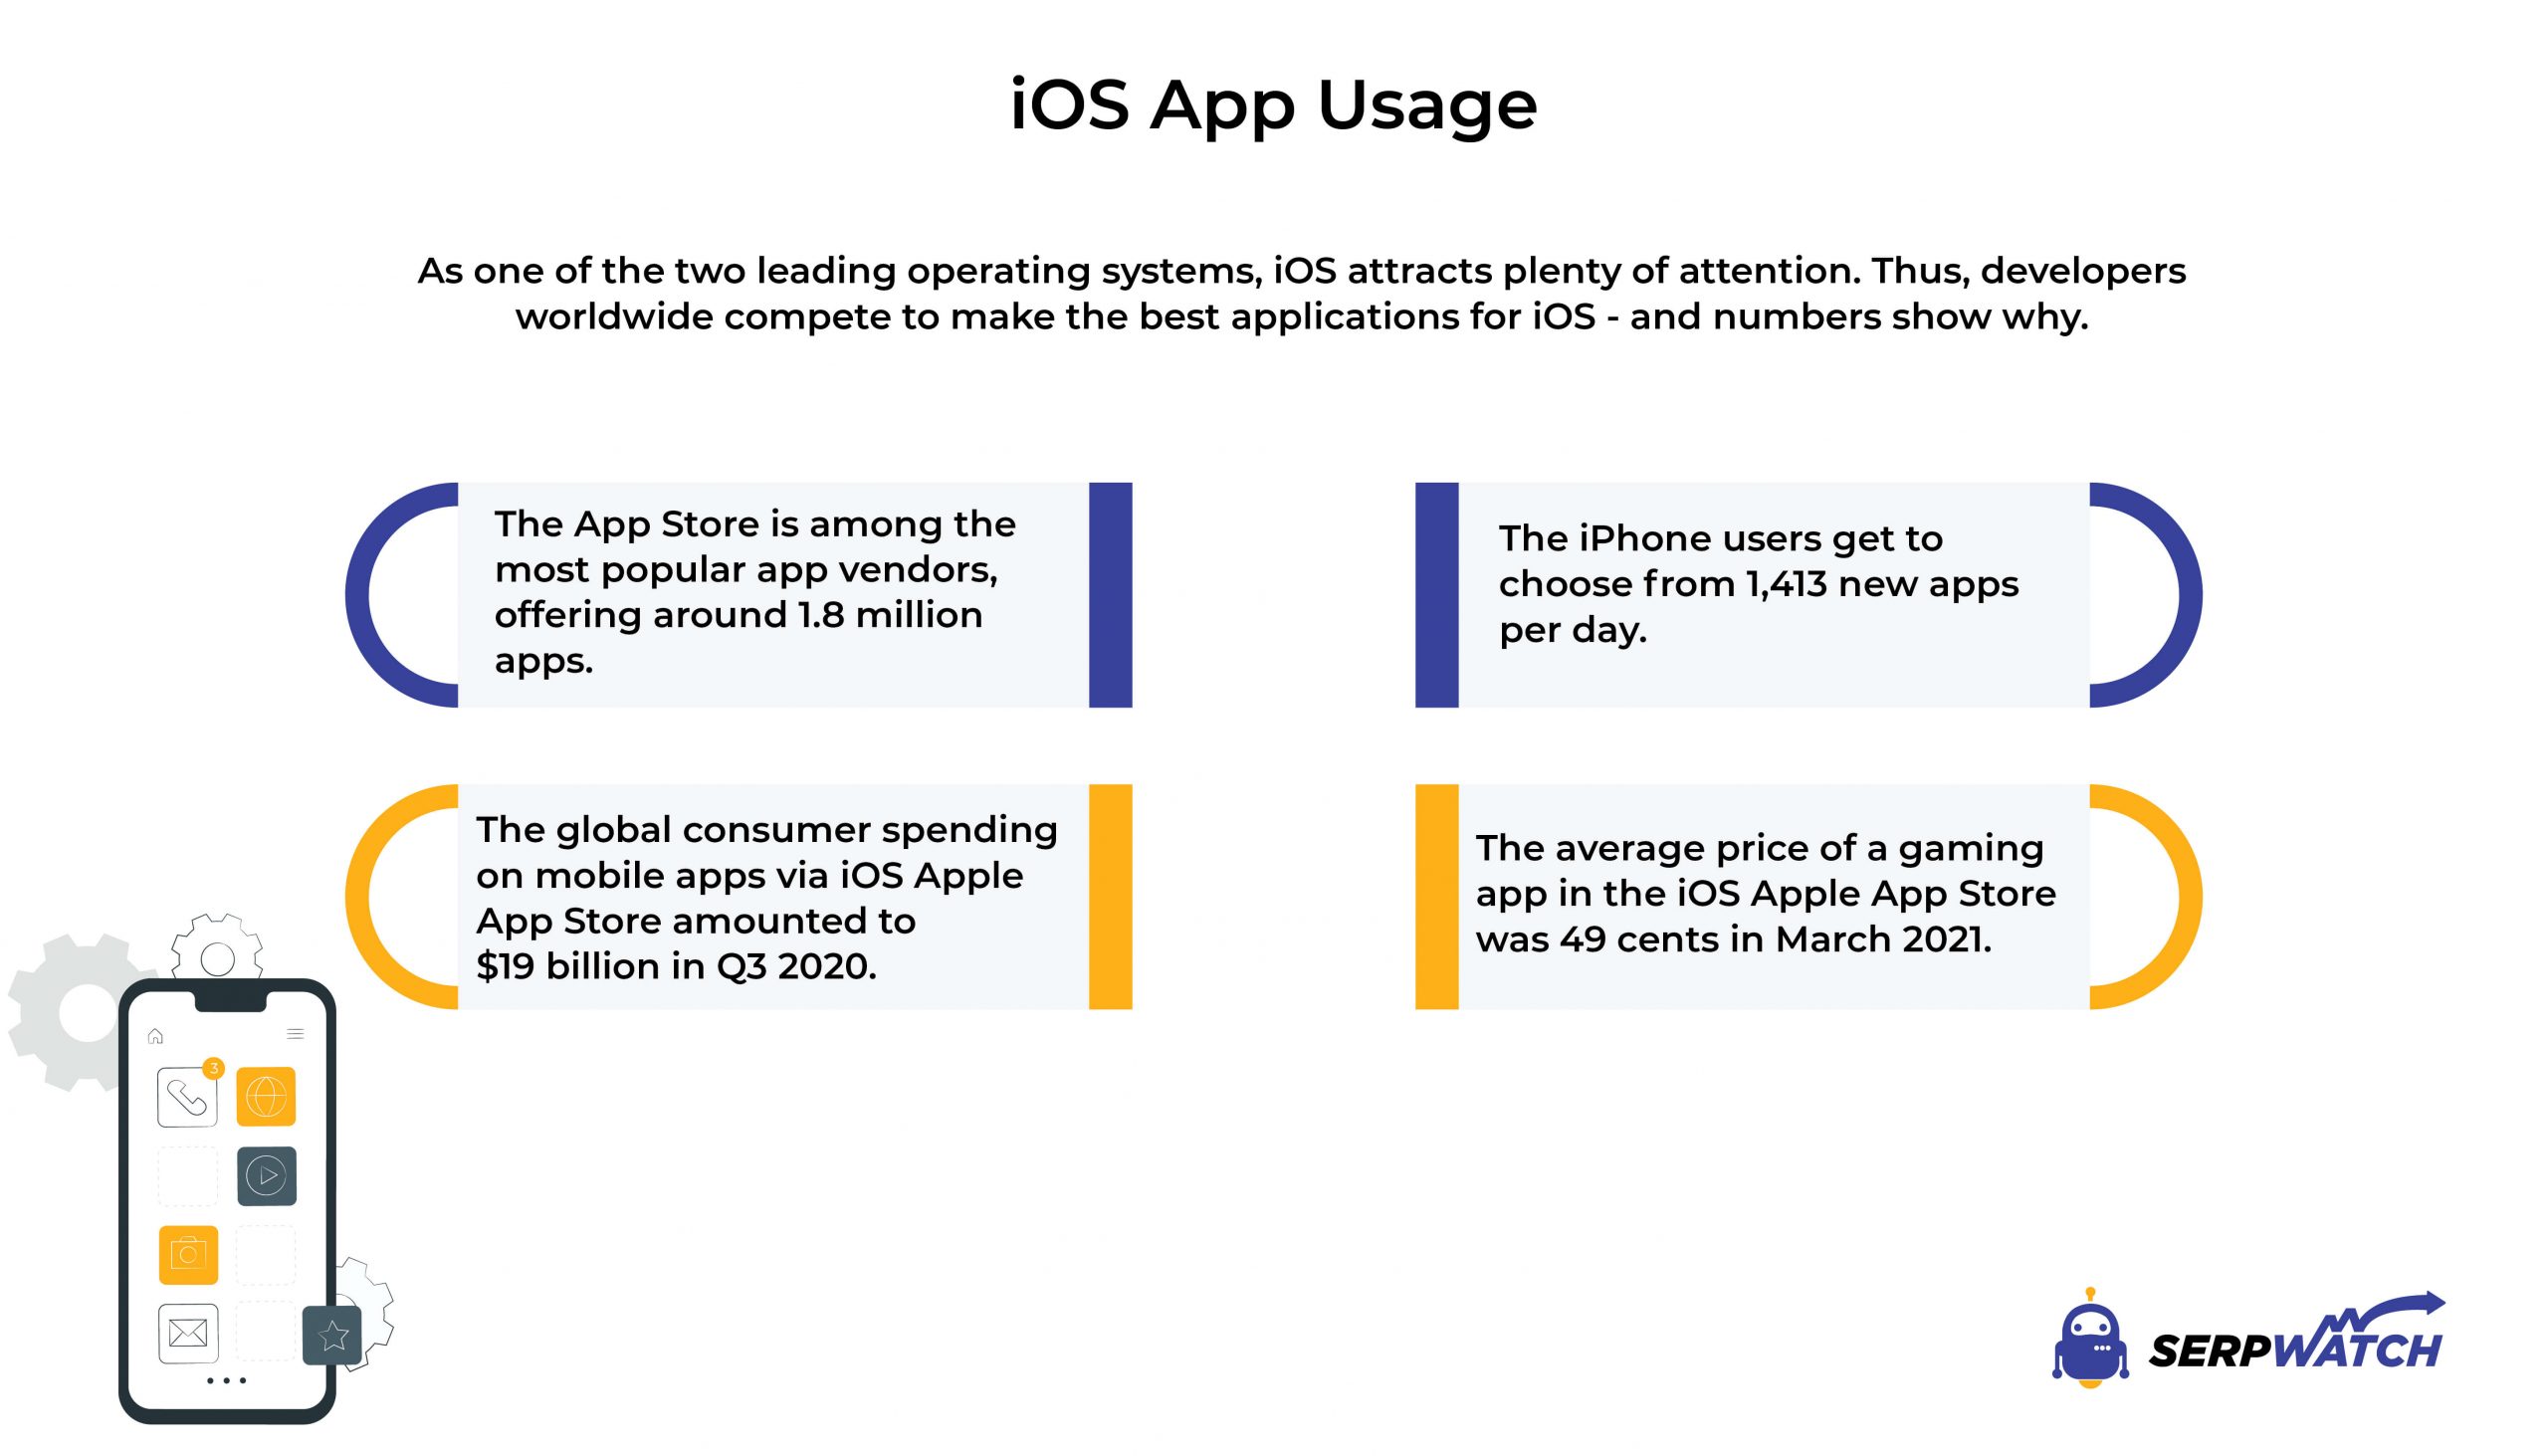
26. The Apple App Store is among the most popular app vendors, offering around 1.8 million apps.
The number of apps in the Apple App Store is continuously growing, and the stats show that the library lists 1,801,909 apps. To date, over 700,000 publishers have published their mobile apps on the Apple Store.
27. According to iPhone usage statistics, the users of these devices get to choose from 1,413 new apps per day.
The App Store library continues to grow, providing users with more and more options. Currently, 86.1% of iOS Apple App Store apps are non-gaming apps, while the remaining 13.9% belong to gaming apps. In the last week of June 2021, for example, publishers added 6,783 new apps to the App Store.
28. In Q3 2020, the global consumer spending on mobile apps via iOS Apple App Store amounted to $19 billion.
Even though the latest app usage statistics show that Apple App Store is behind the Google Play Store regarding the total number of apps, it compensates with massive revenues. For instance, in the third quarter of 2020, the Google Play platform earned “only” $10.3 billion.
29. In March 2021, the average price of a gaming app in the iOS Apple App Store was 49 cents.
More than 22% of apps in the Apple App Store are gaming apps, and most are free to download. Yet, many iOS apps require an upfront payment. The average overall price of mobile apps in the Apple App Store is 82 cents.
App Usage Statistics for Android
As the years go by, Android stands as one of the leading operating systems out there. In addition, various smartphones and other devices support Android, creating a massive market for Android app developers.
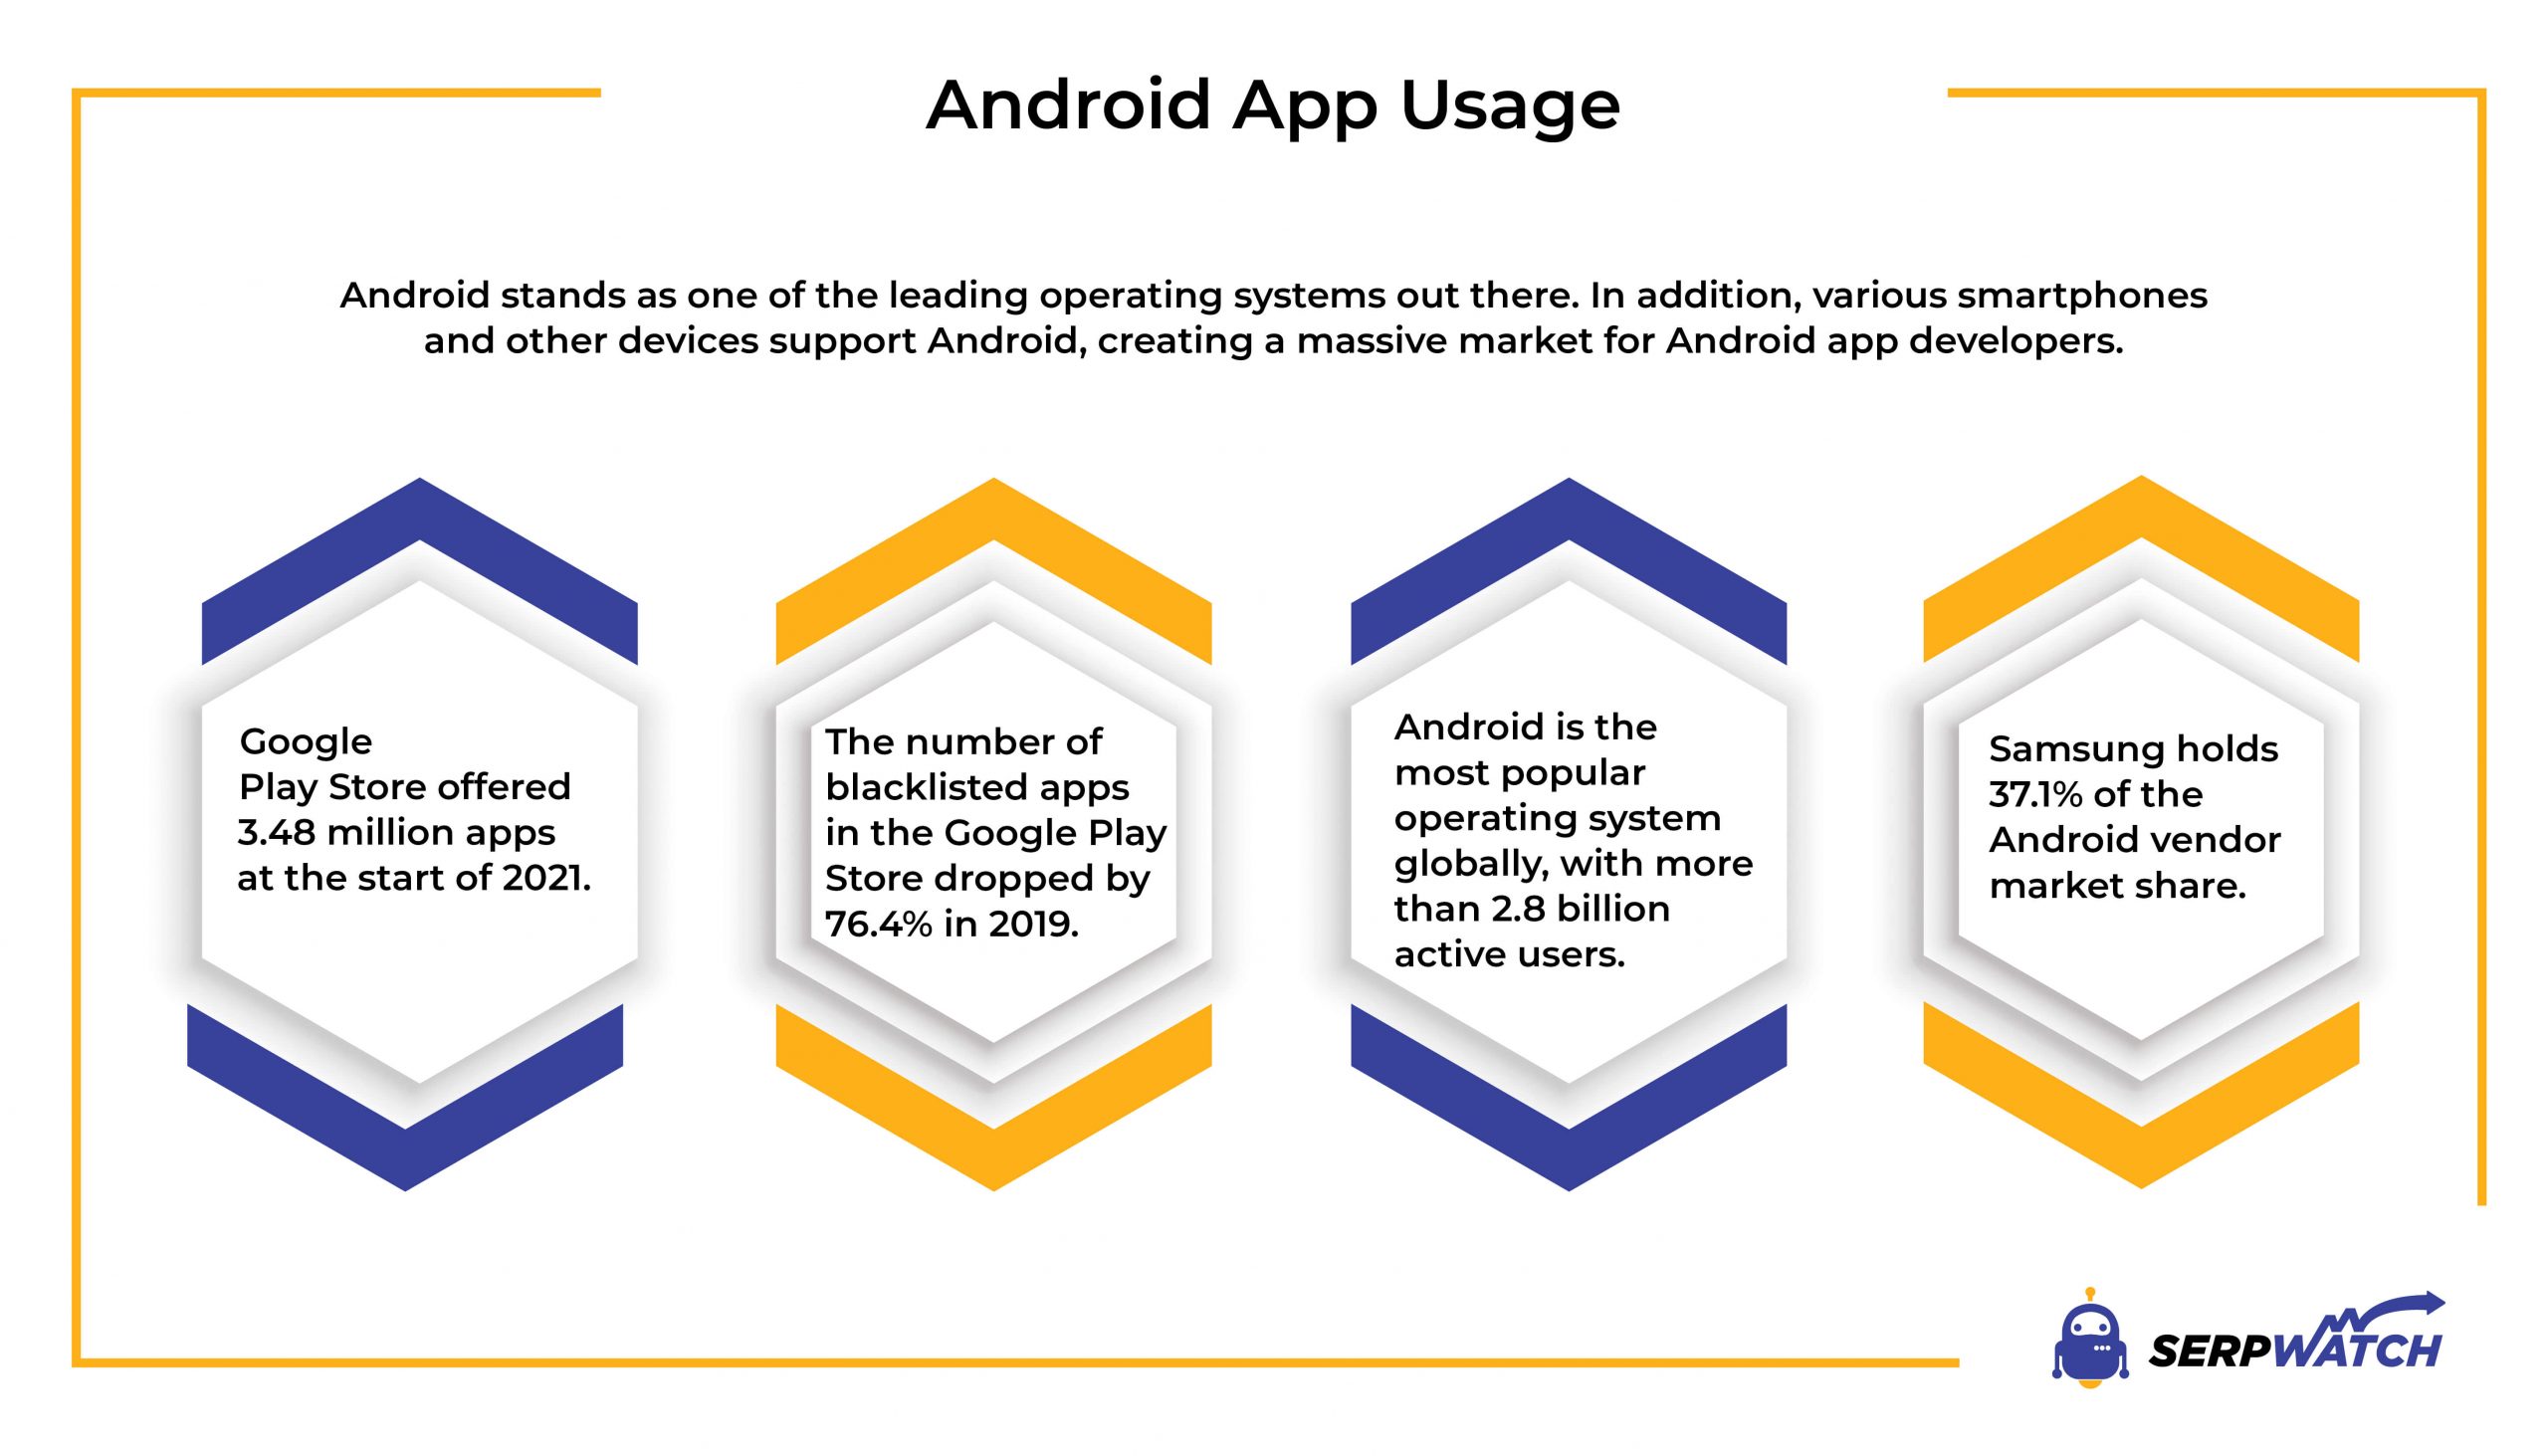
30. In the first quarter of 2021, the Google Play Store had 3.48 million apps.
According to the latest stats, Android users can choose from a vast number of apps. But, of course, the selection is continuously growing, with new apps appearing as we speak. At the same time, Google, just like Apple, removes many low-quality apps from the platform.
31. Thanks to various improvements, the recent Android app usage statistics show that the number of blacklisted apps in the Google Play Store dropped by 76.4% in 2019.
Google bans and blacklists apps because of dangerous, risky, or fraudulent code. As a result, the number of malicious apps and viruses decreased significantly in recent years.
Even so, Google still blacklisted 25,647 apps in 2019 alone. Despite being locked in the Bing vs Google battle, Google continuously improves safety measures and invests in protection systems.
32. Android is the most popular operating system globally, with more than 2.8 billion active users.
According to mobile app usage statistics in India, Brazil, and Turkey, Android holds more than 85% market share.
Over the past decade, Google Play Store spread its reach across almost every country on the planet. As a result, Android has a global market share of 75%.
33. Samsung holds 37.1% of the Android vendor market share.
As far as Android vendors go, Samsung performs significantly better than Xiaomi and Huawei. In essence, the situation in the market hasn’t changed much since 2015. Android apps and Android-powered devices are still equally popular as they were six years ago.

App Usage Statistics for 2021 | The Takeaway
Using an app these days is as normal as breathing, and we rarely even think about it. App stores offer a wide range of options, meeting different needs. On the other hand, publishers develop creative software to solve various problems and attract more users.
For instance, SerpWatch allows for seamless integration with Zapier, deriving data from more than 1,500 apps. On top of that, this rank tracker easily integrates with social media apps, such as LinkedIn and Twitter.
Apps can provide various benefits, and SEO specialists and marketers should take advantage of them. By doing so, they can reach their SEO goals and rank higher than ever.
Frequently Asked Questions | FAQ
What is the most popular app?
The number of apps in the Apple App Store and Google Play Store continues to grow, but the heavy-hitters of the mobile app world remain in charge. Namely, together with its brothers in arms, WhatsApp and Instagram, Facebook has a massive following worldwide.
Yet, the staggering growth of TikTok makes it the most popular app in 2021 by a considerable margin. For instance, 850 million downloads in 2020 alone are a clear sign TikTok rules the current app scene.
How many apps are there?
The adoption of mobile devices increased the need for mobile apps, and publishers are adding more than 1,400 apps to the iOS Apple App Store alone every day. But, of course, desktop applications are also in expansion, and it can be challenging to determine the precise number of apps.
Nonetheless, statistics show that the most significant online app stores in 2021 have around 6.6 million apps combined. Also, we should note that app stores regularly remove low-quality or malicious apps from their platforms, so the total number fluctuates.
How many Android users are there in the world?
Android’s popularity shows no signs of stopping, even though it feels like this operating system has been locked in a battle against Apple iOS for ages. Supported by big names in the smartphone industry, such as Samsung and Huawei, Android continuously expands its customer base.
To be precise, Android now covers more than 190 countries and has over 2.5 billion active users. Globally, Android holds 75% of the market share, and in 2020, more than a billion Android smartphones joined the fleet.
How much does the average app make?
Arguably, every app developer dreams of making a viral app and raking in millions of dollars. Even though some app developers earn six-figure incomes (or higher), most apps bring in little to no money.
On average, iOS mobile apps in the top 200 categories make around $82,500 a day. Yet, the earnings drop as you move away from the top-ranking apps. Namely, mobile apps in the top 800 categories make around $3,500 daily. Of course, the revenue depends on the type of app. For example, gaming apps have the highest earning potential.
How many apps do people really use?
Nowadays, there’s an app for everything, but the average person only uses nine mobile apps per day. Typically, we use around 25–30 apps per month, even though the average millennial has 67 apps installed on their smartphones.
The most popular categories are gaming, education, and health, and most people switch between a couple of these apps each day. But, of course, we often download apps we rarely use, and it all depends on the user’s preferences.
How often are apps used?
Between 2010 and 2019, around 25% of apps were used only once after download. However, the situation hasn’t improved much since, despite better-operating systems and advancements in touchscreen technologies.
Namely, the global app retention after 10 sessions in 2019 stood at 32%. Admittedly, some apps are more used than others, and social media apps and messaging apps are the ones we use the most. However, the reason might also hide in the fact that we are spoilt for choice because the latest app usage statistics reveal we have over three million apps on the menu.
Sources
42matters, Apptopia, Business of Apps, Business of Apps, Business of Apps, CleverTap, eMarketer, Forbes, Forbes, Gallup, Mashable, Sensor Tower, Sensor Tower, Sensor Tower, Sensor Tower, Simform, Statista, Statista, Statista, Statista, Statista, Statista, Statista, The Manifest
Related posts

Unlocking Local SEO Success: A Comprehensive Guide to Elevating Your Business in Local Searches

E-commerce SEO Mastery: Dominate Online Retail with Our Guide

Optimizing for YouTube SEO: Essential Strategies for Video Visibility (With Video Edit Tools)

Understanding and Improving Organic Search Visibility

Uncovering the Secrets of Stunning Web Design for Business Success

There are currently no comments.
Be the first!))